The Zacks Earning Surprises is an interesting and potentially high-alpha data set. It contains earnings estimates of “more than 2,600 analysts from 185 brokerage firms across North America cross referenced with company earnings reports”.
So how wrong are analysts?
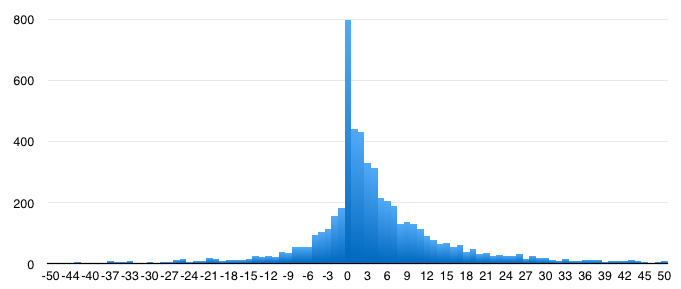
This histogram shows the distribution of percentage errors where percentage is calculated by (100 * (actual EPS – mean estimated EPS) / mean estimated EPS). The data used is Zacks earnings surprises for companies in the S&P500.
On average, analyst’s earnings estimates are 5.82% lower than actual.
