UPDATE: This code uses multi-sets, which are now depricated. Updated code to follow.
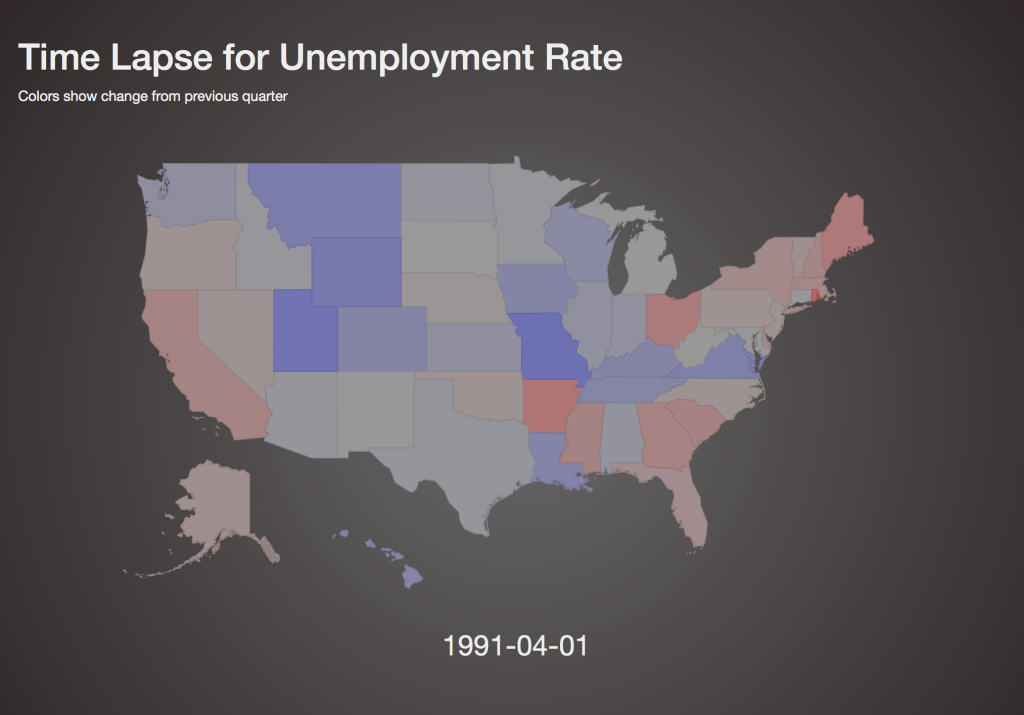
Had a bit of fun with the Quandl API that took data from FRED and created an animated map of unemployment rates. And what the hell, why not go ahead and buy “mapanimations.com” to demo the code, right? (Or click on the image above to see it in action.)
Code is in Plunker, so playing around with the code is easy. First step is to get your own API key to access the data with Quandl. The easiest mod is to change the FRED database it is accessing so you can see animations on things like construction revenue, population size, fertilizer manufacturing or whathaveyou.